A Better Sense of Place
2016 June 19 (Sun)
Describing conditions with graphs
The new front bed that I created in March is an area of stress. I didn't remove the St. Augustine grass after I hoed it and before I sowed seed. I just tossed all the seed right alongside the existing turf grass that I was trying to replace. I was once told (a rumor?) that natives would eventually outcompete the turf grass, so it's not super important to pull everything first.
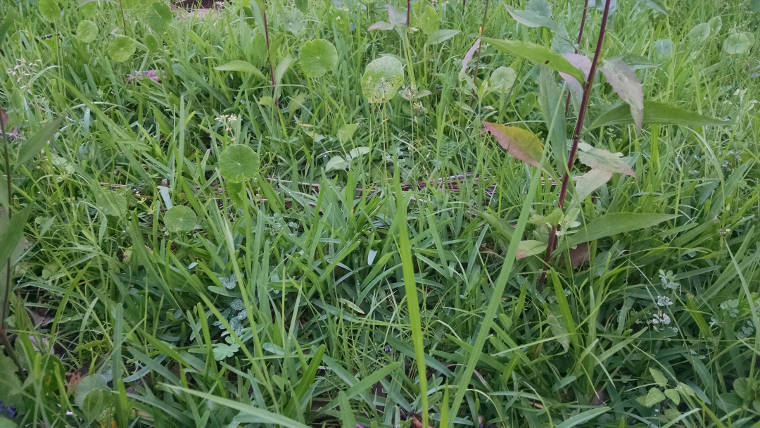 And what I mean by it being an area of stress is that much of the seed has germinated and is now competing against all the existing once-dormant seed and active turf grass. St. Augustine, chamberbitter, and a bunch of other stuff I don't know the names for are taking advantage of the sudden clearing in an attempt to get more light, water, and soil. Because that's what plants do when they are in a good location.
I recently bought a book called Planting in a Post-Wild World: Designing Plant Communities for Resilient Landscapes by Thomas Rainer and Claudia West. I'm going to try my best to write a bit about my reactions to it. I'm learning to think about how, if left alone, plants will fill every space they can. It doesn't matter if it's exotic or native; a plant that can stand a location will grow there. If it is fitter than other plants, it will not be crowded out and killed. If the plant has a strong advantage (as in the case of invasives that have no predators to keep numbers in balance), it will outcompete other plants and become dominant in successive generations. And to add some complexity to this, only plants that make use of the same root depth and leaf height are really in full direct competition, which is how layering of plants is possible. Think canopy, sub-canopy, shrubs, sub-shrub, and ground-covering. (Vines are in there somewhere, too.) And that's just the above ground action. Below ground, plants can have deep or shallow roots to take advantage of niches.
Let's see. What else? Bare ground is a bad idea unless you don't mind endless maintenance to keep it bare. This could be some combination of herbicide, weeding, and mulching. To change your methods to something more sustainable and less tedious, you would instead start thinking of layers and filling in all the gaps so that only the species you want are growing.
And to get to the topic I meant to focus on with this post, the location of species will not be static because they are all in competition with each other to find the best light, soil, and moisture for their individual needs. Because individual plants are born, change size and shape, and die, conditions can't possibly be static. A plant that grows slowly and needs full sun will not do well when it's next to a plant that grows tall and shades it out. For its species' sake at the site, new plants better sprout in those areas that are more agreeable, which could be as close as a couple feet away.
And this is what a couple graphs in the book show: species have preferences for sun and soil moisture along a continuous curve. It's a varying affinity that maxes out at some ideal level. The book's graphs show how multiple species' curves overlap each other to explain why you can't just grow any plant anywhere you want. The site predetermines what can grow there. Plants will do better at locations that match its species' preferences and won't grow as well (or at all) at locations that don't.
This is as far as the book goes with graphing this concept, but you can imagine a bunch of other variables: pH, soil fungal density, calcium levels, soil drainage, and whatever else you can think of. I figure each curve is sort of like a Poisson distribution. Furthermore, the individual plant probably has specific preferences that differ from the species average. Oh, and it's possible that each variable isn't independent: maybe a plant can take more sun if the soil is wetter. (A common trade-off.) It can get complicated fast.
But I wanted to simplify everything so I could model this with some two-dimensional graphs. I made the two graphs below. I focus just on two variables, sunlight exposure and soil moisture, but this can obviously be extended to all sorts of variables. The x-axis of each graph is a physical cross section of some site, such as my front yard, so you can think of the units as distance. I look at two hypothetical cross sections to show how a hypothetical plant of a hypothetical species would respond at each location along the cross sections.
The y-axis of each chart is the intensity or amount of sunlight or soil moisture, a combined scale to simplify things. 100% sun means all sun, all the time. 0% sun means complete shade (such as night time). 100% soil moisture means soil saturation. 0% soil moisture means bone dry. The "Sun" and "Soil moisture" curves show the sun and moisture intensities along the cross sections.
Then I added an orange and a blue horizontal band to show the ideal intensities for the hypothetical plant in question. (To simplify the visualization, I'm only showing an arbitrary range around the species' max preference, something akin to a standard deviation.)
Finally, I show with vertical grey bands where the site's conditions are most suitable for the plant for each variable, sun and moisture.
In this first chart, you can see that there is no location along the yard cross section where conditions are suitable for both sun and moisture. The plant would not really do well anywhere.
But in the second chart, there is part of the cross section where the site provides sun and moisture in intensities that the plant would find most agreeable. That's where the plant should be placed.
This analysis can be done for every variable, though it could be pretty hard for other variables to get the needed data resolution. But the point is that the site determines where you should consider planting something. It also determines how species populations shift around as time goes on. A garden design is best started only after realizing this.